Passive funds are generally a cheaper way to invest compared to their active counterparts, but cost is not the only factor that savers should pay attention to.
As the name suggests, index funds track the performance of a particular benchmark, aiming to reproduce their performance. This may seem to be an easier task to achieve, but some are more successful than others.
Passive investment houses have their own methods to track indices, which results in contrasting outcomes. While some trackers’ performance will very closely replicate their benchmark, others will deviate from it to some extent.
A common measure to assess the deviation of a fund from its benchmark is the tracking error. A tracking error below two indicates a close fit between the fund and its benchmark, while a tracking error of three and above shows a looser correlation.
Using the tracking error measure, Trustnet has researched the passive funds that have been the best at replicating major indices over 10 years.
To do this, we looked at the tracking error of every passive in the Investment Association universe with a 10-year track record, comparing them against their relative benchmark.
Source: FE Analytics
With a tracking error of 0.04, Vanguard FTSE 100 UCITS ETF has been one of the funds that has been the best at reproducing the performance of its benchmark (the FTSE 100) overall.
Its ongoing charge figure (OCF) is 0.09%, which is slightly higher than the 0.07% proposed by its nearest contender, iShares Core FTSE 100 UCITS ETF. The latter fund has, however, deviated slightly more from the FTSE 100’s performance, with a tracking error figure of 0.06. Both fell well within the score of two highlighted above.
For investors looking to tap into UK businesses with a higher potential for growth than the FTSE 100 constituents, the FTSE 250 index of mid-caps may be an apt choice.
The best tracker to capture the performance of this index over 10 years has been iShares FTSE 250 UCITS ETF, with a tracking error of 0.05 an OCF of 0.04%. Its nearest rival is HSBC FTSE 250 UCITS ETF with a tracking error of 0.06 and an OCF of 0.35%.
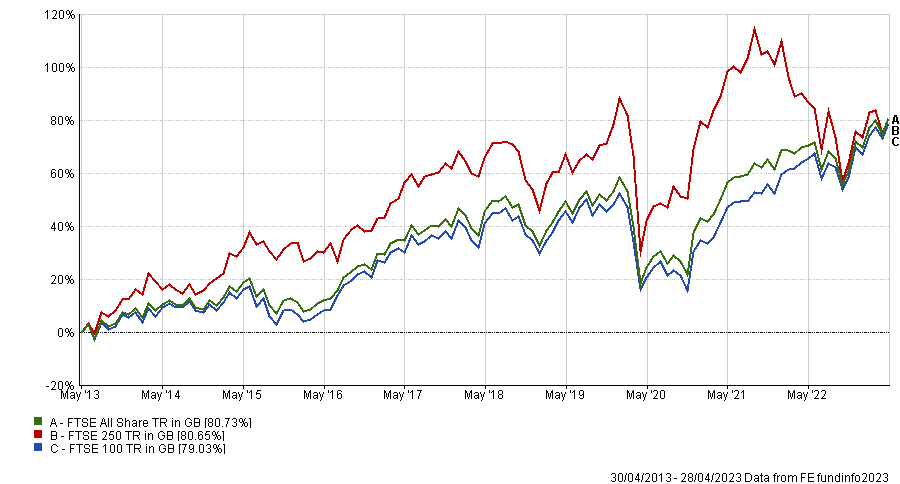
Performance of FTSE UK indices over 10 years

Source: FE Analytics
SSGA SPDR FTSE UK All Share UCITS ETF was the fund to own for investors looking to accurately track the performance of every listed UK company. It has a tracking error of 0.09 and an OCF of 0.2%. An alternative solution could have been Aviva Investors UK Index Tracking 2 with a similar OCF but a higher tracking error of 0.22.
Away from the domestic market, perhaps the most common area investors use passives is the US. This has proven profitable for savers as the large-cap tech names that dominate the largest US indices have surged, making it difficult for active managers to outperform.
Pictet USA Index I NAV was the fund to own to ride the growth of the US S&P 500 index, with a tracking error of 0.05 and an OCF of 0.3%.
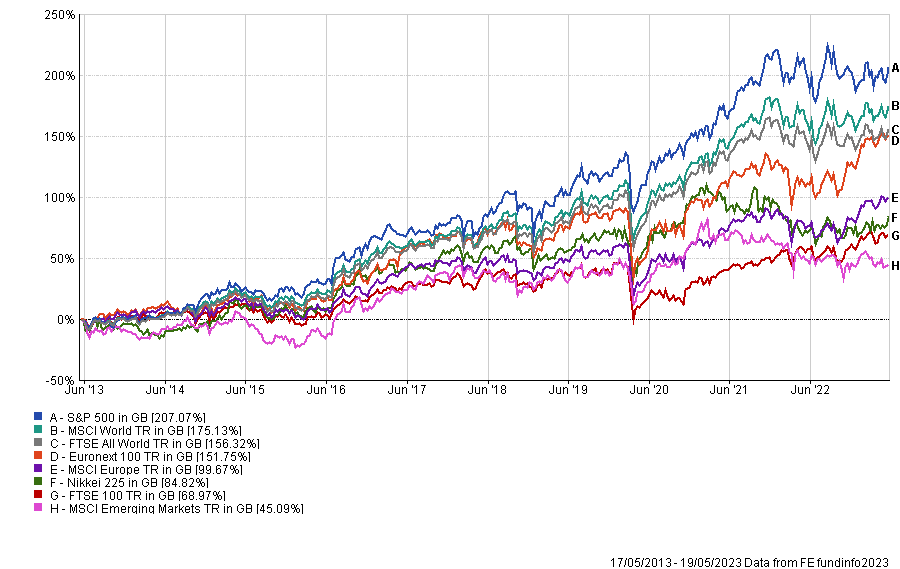
Performance of major indices over 10 years

Source: FE Analytics
With a tracking error of 0.12, SSGA SPDR S&P 500 UCITS ETF, Vanguard S&P 500 UCITS ETF and Vanguard US500StockIdx Investor were the next best options.
Elsewhere, while it has been unloved for several decades, the Japanese market seems to be on its way back, with the Nikkei 225 recently hitting a 33-year high. Over the past 10 years, iShares Nikkei 225 UCITS ETF has been the fund reflecting the performance of the index the most, with a tracking error figure of 1.44.
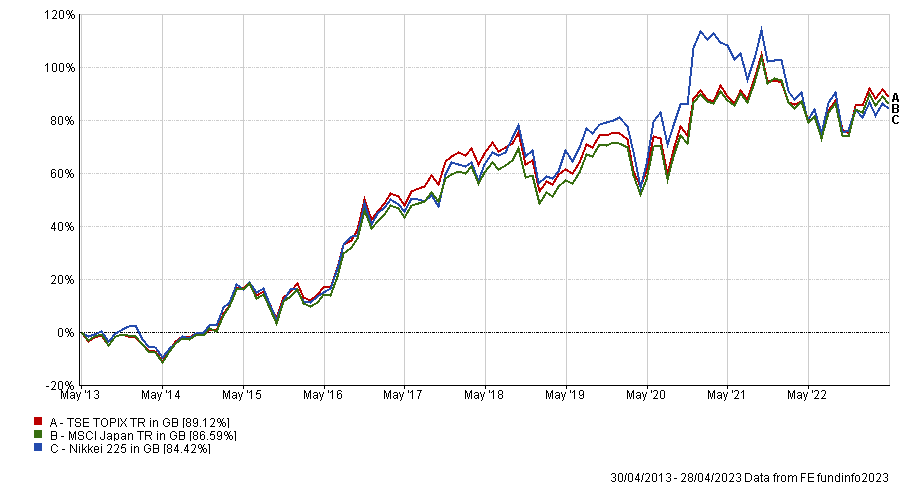
Performance of Japanese indices over 10 years

Source: FE Analytics
Other indices for Japanese stocks include the MSCI Japan and Topix. With tracking error figures of 0.32 and 0.88, Vanguard Japan Stock Index and Lyxor Japan (TOPIX) (DR) UCITS ETF were the two funds most closely mirroring the performance of these indices respectively.
Meanwhile, on the continent, MSCI Europe, MSCI EMU and EURO STOXX 50 are the most common benchmarks for funds . SSGA SPDR MSCI Europe UCITS ETF, SSGA SPDR MSCI EMU UCITS ETF, Lyxor Core Euro Stoxx 50 Dr UCITS ETF are the funds that have the most closely mirrored the performance of those indices. Their tracking error figures have respectively been 0.13, 0.24 and 0.47 over 10 years.
For global developed market investors, Vanguard funds have been the best at replicating two of the main global indices: the FTSE All World and MSCI World. Those funds are Vanguard Global Stock Index Investor and Vanguard FTSE All World UCITS ETF, with tracking error figures of respectively 0.08 and 0.07.
Lastly, looking at emerging market funds, these also use a range of benchmarks, such as the FTSE Emerging Markets or the MSCI Emerging Markets index.
Vanguard FTSE Emerging Markets UCITS ETF has had the closest performance to the FTSE Emerging Markets index, with a tracking error of 0.39. As for the MSCI Emerging Markets Index, Vanguard Emerging Markets Stock Index has been the best passive fund tracking it and has a tracking error figure of 0.77.


