


Investors should keep a close eye on indicators such as transport stocks, small-caps and copper in order to gauge the possible direction of the economy and financial markets, according to AJ Bell.
The second presidency of Donald Trump in the US, coming after more than a decade of unorthodox monetary policy, failed attempts at austerity, ballooned government debt and the fallout of the Covid pandemic, means investors are split on whether the globe is headed into inflation, deflation or stagflation.
Russ Mould, investment director at AJ Bell, said: “All three of those potential endgames would require a different portfolio allocation, at least if history is any guide, with inflation perhaps leaning toward select equities and ‘real’ assets such as commodities, deflation favouring cash and bonds and stagflation, the worst of all worlds, putting gold and commodities (again) in the driving seat.”
To help investors guess what might be coming, AJ Bell offers up five indicators that can give a steer on what is happening in the global economy.
Transport stocks
Proponents of Dow Theory – which is a form of technical analysis derived from Wall Street Journal editorials of Charles H. Dow – watch transportation stocks as a bellwether of the wider economy.
Because a strong economy means there’s strong demand for goods, products need to be shipped from manufacturers to retailers and wholesalers to replenish shelves. Therefore, strong performance from freight, truck, airline and shipping companies suggests the economy is doing well.
Of course, the opposite also stands. If transportation companies are struggling, then it suggests diminishing economic activity.
Performance of Dow Jones Industrials and Dow Jones Transportation indices over 1yr
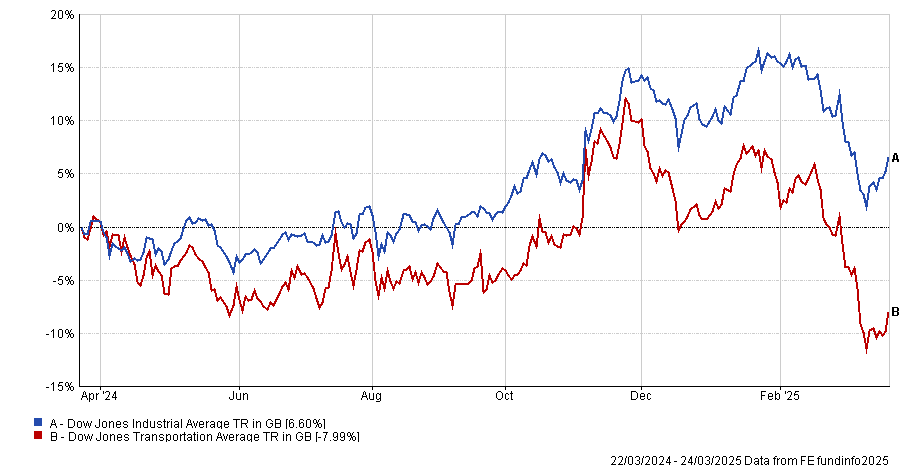
Source: FE Analytics
“It will therefore be of some concern to bulls of US stocks to see the Dow Jones Transport index slide by 18% from last November’s high, to leave it on the fringes of bear market territory,” Mould said.
This could indicate that the US is moving towards slowdown or recession.
Small-caps
The small-cap Russell 2000 index initially rallied after Trump won the 2024 election but, like the transportation index, is currently pointing to a slowdown or recession.
UK small-caps paint a similar picture.
Performance of US and UK small-caps over 1yr
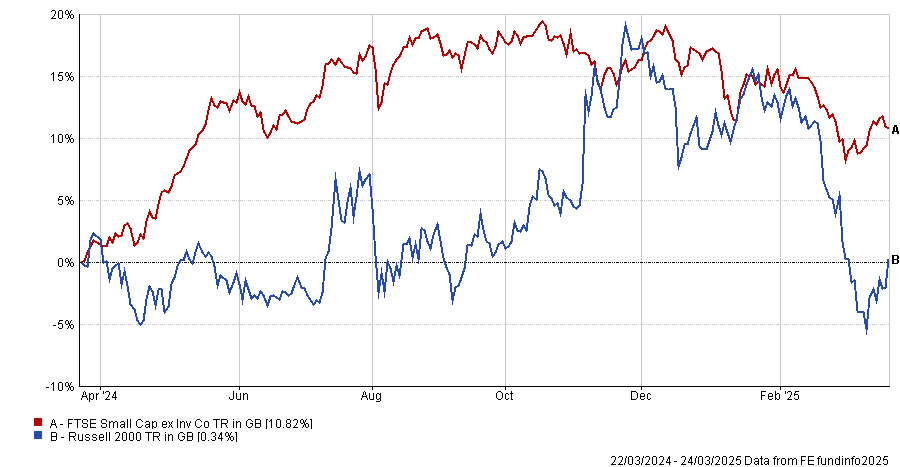
Source: FE Analytics
“Small-cap companies tend to be less well-resourced than their multi-national, mega-cap peers, and are often more dependent upon their domestic economy as a result,” Mould said.
“As such, they can be seen as a guide to trends in local output, so the slide in market minnows on both sides of the Atlantic could be seen as a harbinger of an economic slowdown.”
Semiconductor stocks
The AJ Bell investment director also argued that silicon chip and semiconductor production equipment (SPE) manufacturers can also be a useful economic indicator. Silicon chips are widely used in electronic devices ranging from smartphones to cars to servers, meaning they are in demand from every part of the economy.
Although the industry’s annual sales are expected to reach a new all-time high of almost $700bn this year, it’s worth remembering that it is cyclical. Semiconductor stocks often experience booms driven by spikes in demand from new applications followed by busts, as output slows because of a wider economic slowdown.
Performance of Philadelphia Semiconductor index over 1yr
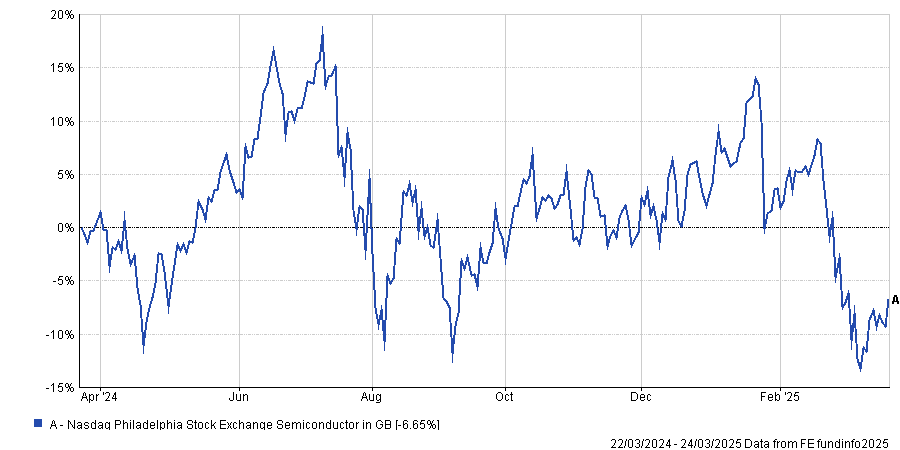
Source: FE Analytics
“The Philadelphia Semiconductor index, known as the SOX, consists of 30 major silicon chip and SPE specialists,” Mould said.
“It may be a source of discomfort to bulls to see the benchmark sit below where it lay a year ago, for all of the hoopla surrounding AI and the SOX has dropped to more than a fifth below last summer’s peak – bear market territory.”
Copper
Copper is used in many parts of the economy, from white goods to cars to construction. Because of this, it is often seen as a good guide to global economic health – so much so that its nickname is ‘Doctor Copper’.
Copper prices fell in 2024 on the back of China’s real estate bust but have bounced back this year. AJ Bell said the rally could be bolstered by more monetary and fiscal stimulus from Beijing as well as Germany’s proposals for debt-funded growth.
Copper over 1yr
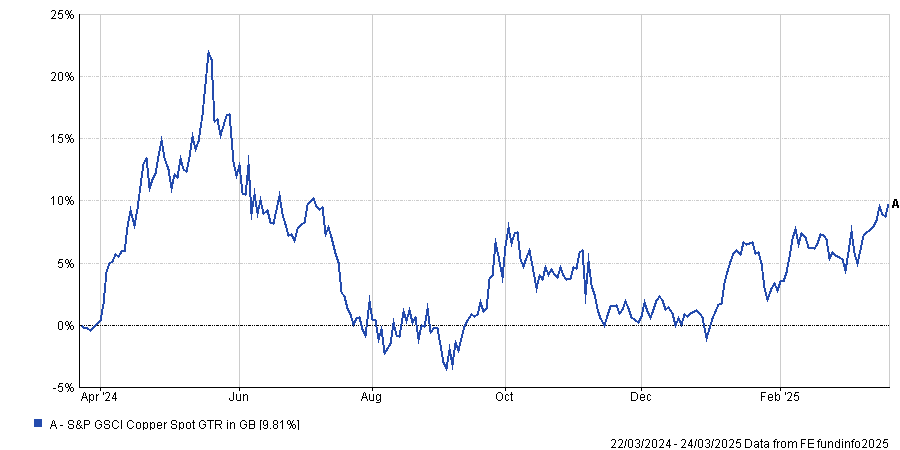
Source: FE Analytics
However, part of the rise in demand could be copper traders buying up supplies in case the metal is subject to US tariffs. It could also be investors buying up real assets to protect against inflation or stagflation.
As such, Mould thinks the copper price could be indicating growth or higher inflation from here.
Government bonds
Interest rates have been trending downwards across the globe, with 193 rate cuts from central banks in 2024 and another 31 so far this year. However, 10-year government bond yields have not moved lower in anticipation of more to come, as might be expected.
This dynamic could be explained by worries over increased supply of government debt and concerns over the potentially inflationary impact of the US’s tariffs, according to Mould.
AJ Bell said bond yields seem to be pointing to inflation or stagflation.
10yr government bond yields
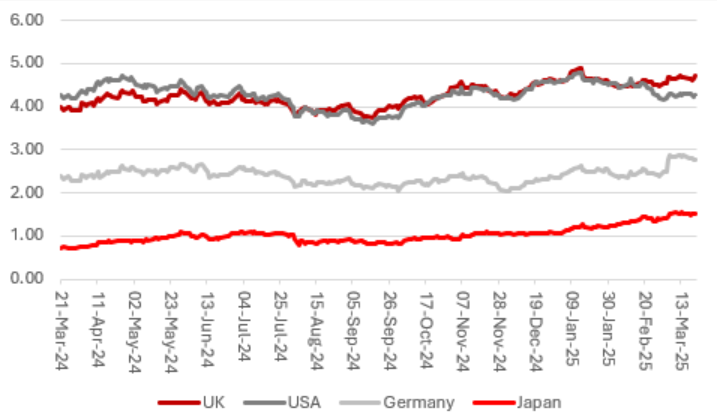
Source: LSEG Refinitiv data
Mould finished: “The unpleasant conclusion from these five trends is that the global outlook is deviating from the one which markets priced in so enthusiastically in 2024, namely a return to the low growth, low inflation, low interest rate world that had worked so well for bonds and long-duration assets such as technology stocks during the 2010s and early 2020s.”
He offered one final indicator that investors might want to keep an eye on: “If the environment really has changed – and we are now in an era of inflation or stagflation and not the low-growth, low-rate, low-inflation murk that dominated in the wake of the financial crisis – then it could just show up in how the CRB Commodities benchmark does relative to the S&P 500. Such a dramatic change may just favour commodities, at least if the experiences of the 1970s are any guide.”