Can I play devil’s advocate for a minute? What if the US equity market does not keep rising inexorably?
Yes, I know everyone from Rathbones to BlackRock is overweight US equities and that the fund management community has become remarkably more bullish since Donald Trump won the US election.
And when I canvassed opinions recently about whether global benchmarks had too high an allocation to the US, most experts said the US dominates equity markets for solid reasons, such as higher growth and technological prowess.
But what if they are wrong?
What if the mega-cap tech companies that form such a large part of global and US equity indices fail to meet investors’ sky-high expectations, sentiment starts to turn and the whole thing collapses like a pack of cards? We got a whiff of what that might look like in August but stock markets dusted off the summer volatility remarkably quickly.
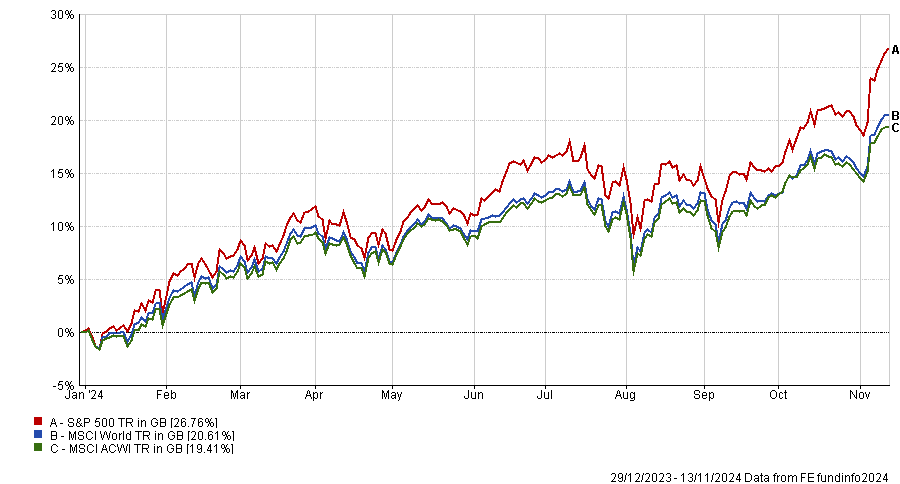
Dissenting voices can be heard if you listen hard enough. Goldman Sachs forecasted that the S&P 500 will return an average of 3% per annum in US dollar terms over the next decade. That compares to a 26.5% year-to-date gain as of 13 November 2024.
Goldman Sachs’ forecast is so low due to high US equity valuations and the index’s intense concentration, making it vulnerable to any upset amongst the best-known names.
I worry about whether investors who buy a global tracker in the belief that they are getting global diversification and exposure to thousands of companies understand the increasingly narrow basket of risks to which they are exposed.
Indices are Darwinian in that they evolve to overweight the most successful companies and regions, a momentum-driven dynamic that has rewarded investors handsomely in recent years. Yet they weight companies according to size rather than fundamentals so by definition they are backward looking.
I’m not the only one who’s worried. Laith Khalaf, head of investment analysis at AJ Bell, has been sounding a note of caution for months about high valuations and increasing index concentration, and even though both he and I have been proved wrong this year, he told me that he continues to be stubbornly cautious.
Performance of US and global equities, year-to-date

Source: FE Analytics
If investors don’t want to buy a passive global equity fund with a massive allocation to the US (65% for the MSCI All Country World Index or ACWI and 73% for the MSCI World) what other options are there?
Khalaf suggested two approaches. First, pick the funds and managers you like and think will outperform. The regional allocation might be quite random as a result, however, so some top-down analysis would also be required. Or you could pick global managers and delegate geographic decisions to them.
The second option he proposed was equally weighting all five major regions (US, Europe, UK, Japan and emerging markets) as a starting point. Investors may want to tweak the allocation from there, for instance by putting 40% in the US because it is the world’s largest market and has performed so well, which would leave 15% for each other region.
Anyone who has done this in recent years would have been kicking themselves, he admitted, because their returns would have fallen behind the US and global benchmarks.
Yet going forward the approach appeals because investors would be exposed to a more diversified pool of regional risks and less vulnerable to a pullback in the US tech sector.
A further consideration is whether to make a dedicated allocation to small-caps, which are historically cheap versus large-caps and which many experts expect to outperform as interest rates come down. US small-caps, in particular, should benefit as Trump tries to turbocharge the domestic economy.
Savvy stock picking can make a significant difference in small-caps, Khalaf said, so this is an area that favours active managers and currently, “managers are champing at the bit and saying how many opportunities they are seeing”.
Two funds he favours are abrdn Global Smaller Companies and Tellworth UK Smaller Companies.
Kirsty Desson, who manages the abrdn fund, worked with small-cap veteran Harry Nimmo before he retired in 2022. Nimmo developed a stock-screening process called the Matrix and abrdn still has a very well-defined investment process, Khalaf said.
Tellworth’s Paul Marriage has built a diversified portfolio by investing in different types of company, from well-established ‘3PM’ stocks to valuation opportunities that the market has misunderstood. The P in P3M stands for a differentiated product backed by research and development. The three Ms are market leadership in a niche industry, the ability to grow profit margins and management whose interests are aligned to shareholders.
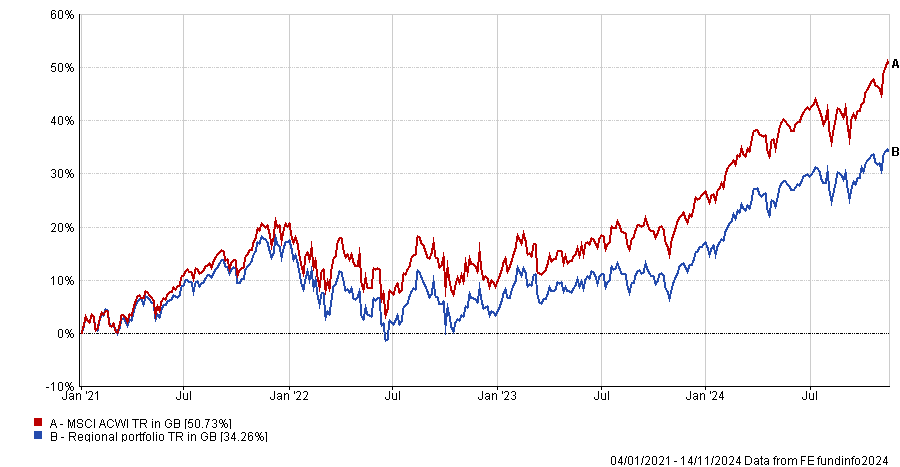
To test out a more equally balanced regional allocation, I built a bespoke portfolio with 40% in the US, 12% in global small-caps using the abrdn fund, then 12% each in the other regions (UK, Europe, Japan and emerging markets) using well-known indices as a proxy for passive funds, and set it to rebalance quarterly.
Performance of regional portfolio vs MSCI ACWI over 20yrs

Source: FE Analytics
This portfolio has underperformed the MSCI All Country World index in sterling terms over every time frame I tested but performance data is backward looking and the past decade in particular has been a period of US hegemony.
In discussing other ways to slice and dice the global equity pie, we are contemplating a very different hypothetical future where the US underperforms other regions and a massive US allocation becomes a headwind.
Another idea would be to buy a passive fund tracking a fundamental index, such as those designed by Research Associates. Its FTSE RAFI index series weights constituents by factors including total cash dividends, free cash flow, total sales and book equity value.
The FTSE RAFI All-World 3000 index has 50.8% in the US, 1.1% in Apple and 0.9% in Microsoft, whereas FTSE All-World index has 63.4% in the US, 4.2% in Apple and 3.9% in Microsoft.
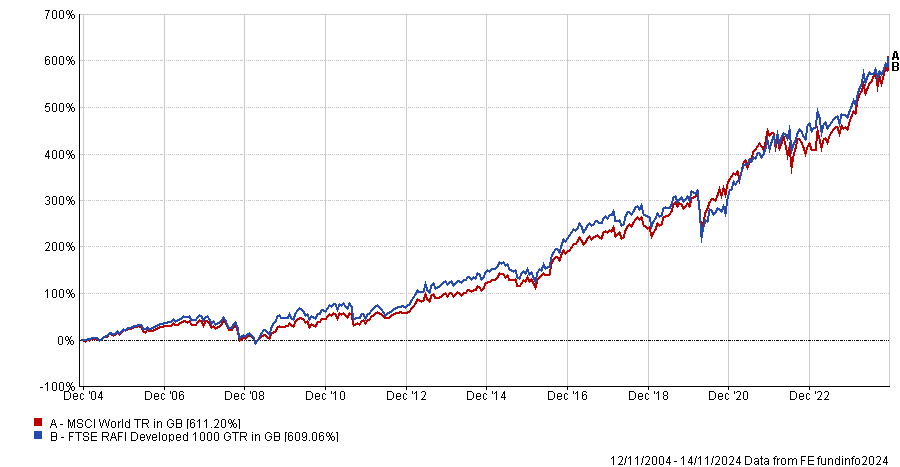
The FTSE RAFI Developed 1000 has lagged the MSCI World in the past decade by a wide margin but across 20 years, the two benchmarks are neck and neck, as the chart below illustrates.
Performance of FTSE RAFI Developed 1000 vs MSCI ACWI over 20yrs

Source: FE Analytics
At the end of the day, it is for individual investors to decide what risks they want in their portfolio, how much US exposure they are comfortable keeping and whether they expect American exceptionalism to continue.


