Over the past five years, the S&P 500 has been the best performing major index, but this is also true over 10 years, 15 years and even 20 years.
In fact, £1,000 directly invested into the S&P 500 five years ago would have grown to £1,763.46, a 76.35% increase.
Therefore, investors would have done well by putting their money in a passive fund tracking the performance of the S&P 500, especially in a market where active managers notoriously struggle to beat their benchmark.
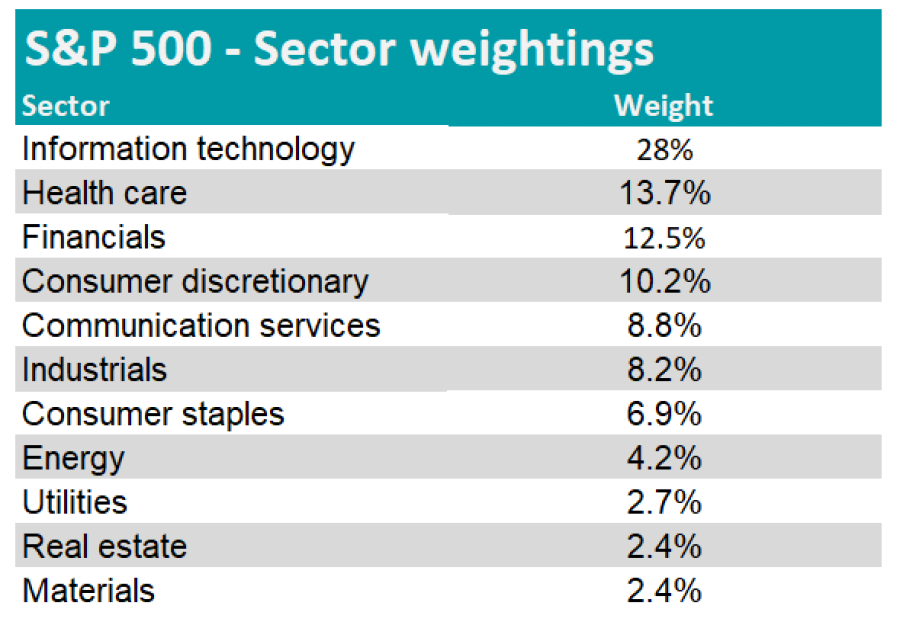
Information technology is unsurprisingly the largest sector in the S&P 500, as the FAANG stocks have spearheaded the strong performance of the index in the past couple of years. Healthcare and financials are the two next largest sectors in the index.
S&P 500 – Sector weightings

Source: S&P Global
HSBC American Index would have delivered the best return over five years, delivering £1,789.26 for £1,000 invested. That is 2.6% in excess of the S&P 500.
Most of the S&P 500 trackers that have offered the best returns to investors in the past half decade have actually outperformed the index.
While extra gains are always welcome, investors should keep in mind that an outperformance reveals a higher tracking error. It means that the fund does not perfectly replicate the performance of the index it is tracking.
Although a tracker’s methodology may have enabled it to beat its benchmark, this could backfire in the future.
Returns of funds over 5yrs on £1,000 invested
![]()
Source: FE Analytics
Among the list, HSBC American Index has the highest tracking error at 5.55%, while Pictet USA Index has the lowest tracking error at 0..
The cheapest S&P 500 trackers are HSBC American Index and Fidelity Index US, with an ongoing charge figure (OCF) of 0.05%.
With an OCF of 0.31%, Pictet USA Index is the most expensive passive funds in the list.


