


Markets are recovering some of the ground they lost in Monday's brutal sell-off but investors have been warned that volatility could persist for some time, so what indicators can help them make sense of it all?
AJ Bell investment director Russ Mould gave three factors that are likely to be driving the fall in stock markets: investors worrying that the US is heading into recession, an unwinding of the ‘carry trade’ that has bolstered global liquidity and high valuations leaving some parts of the market vulnerable to a correction.
“The question now is whether this is just a tempest in a teapot, and the result of thin trading volumes as the big hitters head to the beach and leave deputies and juniors in charge, or whether it is the harbinger of a more serious – and bearish – shift in market sentiment,” Mould continued.
“Tracking the yen, the VIX index and the Dow Jones Transportation index might help investors to work out what is coming next, as the worries over the trajectory of the US economy, a rally in the yen and stretched valuations put stock markets to the test.”
Below, we take a closer look at these three indicators and what they can tell investors.
The VIX index
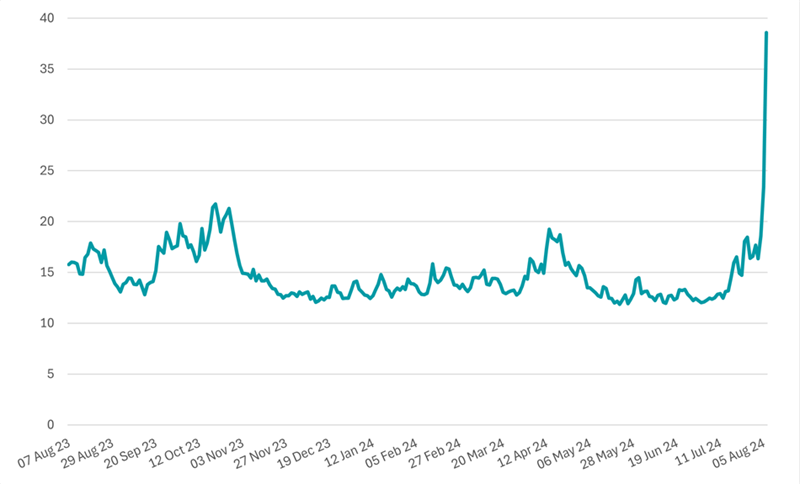
The VIX, or CBOE Volatility Index, measures market expectations of near-term volatility expressed by S&P 500 stock index option prices. It is often referred to as the ‘fear index’ because it reflects investor sentiment and market risk.
Since 1994, the VIX’s long-run average reading is 19 but climbed to around 42 during yesterday’s session – a jump of more than 80% - before falling back. As the chart below shows, the VIX had been climbing for several weeks.
VIX over 1yr
Source: CBOE
“It is usually a good counter-cyclical indicator. Sustained periods of low readings, down toward 12 or lower, speak of investor complacency and likely trouble ahead (because it won’t take much to frighten everyone),” Mould said.
“A sustained run above, say, 30 suggests there is panic around and there may be bargains appearing, but the shake-out in this case could be violent. This simply distils Buffett’s maxim about being fearful when others are greedy and greedy when others are fearful.”
The yen
The AJ Bell investment director also tipped the yen as a near-term indicator for investors to watch, given its “pivotal role” in global market liquidity.
The yen carry trade – borrowing in yen and using that money to go long non-Japanese risk assets – has been a major source of liquidity but this trade is being unwound as the currency strengthens after the Bank of Japan hiked interest rates.
This was one of the reasons why Japanese equities crashed more than 12% during the sell-off on Monday. It was also behind some of the falls in stocks in the US and other markets, as investors sold these assets to unwind their trades.
Performance of the yen relative to the US dollar over 1yr
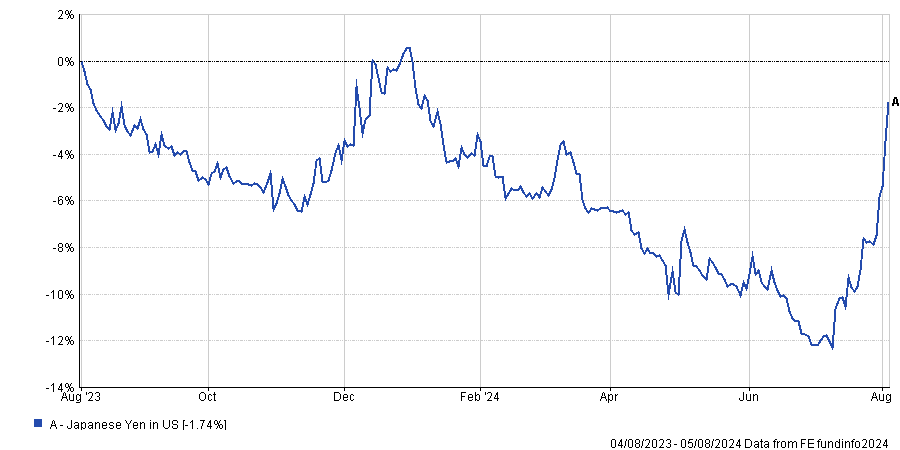
Source: FE Analytics
“If the Bank of Japan backtracks on its promise of more rate hikes that might help, although whether that stokes global inflation expectations is another challenge,” he said.
“Rapid cuts from the Fed and other central banks might stoke money supply and liquidity in the West, but they might fuel inflation fears too – which may be why gold is holding firm.”
The Dow Jones Transportation index
The third and final indicator to keep an eye on is the Dow Jones Transportation index, which measures the performance of 20 leading transportation stocks in the US. Investors often use it for an insight into the health of the broader US economy, as transportation activity often correlates with overall economic growth.
Performance of indices over 1yr
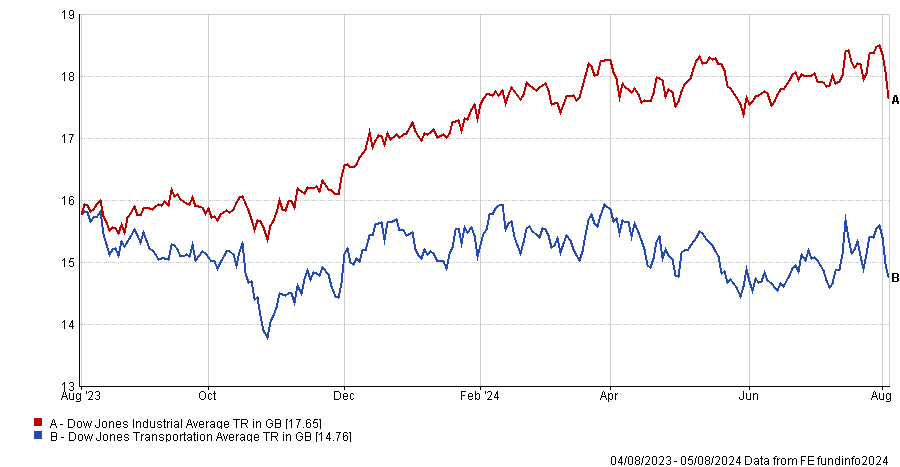
Source: FE Analytics. In US dollars
“For those looking for an indicator that looks at both US markets and the US economy (and we are focusing on those as they are the biggest in the world on both counts) then nothing is usually more helpful than the Dow Jones Transportation index,” Mould said.
“It has lagged the Dow Jones Industrials and lost momentum. That is usually a bad sign, as it speaks of economic weakness. That indicator needs to start trucking again or a summer squall could turn more serious.”