


Market concentration has intensified over recent decades, with a small number of companies and sectors now dominating global equities. This trend is driven by the increasing focus on high-growth areas such as technology, creating a market where the performance of major indices is heavily influenced by a few mega-cap firms.
Investors need to be aware of these concentration dynamics because they shape risk and opportunity. A market driven by fewer, larger players can deliver outsized gains but also poses significant vulnerabilities if those key sectors or companies falter.
Below, Trustnet explores these trends through a series of charts from a recent Bank of America note, offering insights into the shifting drivers of market concentration such as the rise of tech dominance, the decline of traditional sectors and a record weighting to the US’ five biggest companies.
MSCI AC World regional share by market cap since 1998
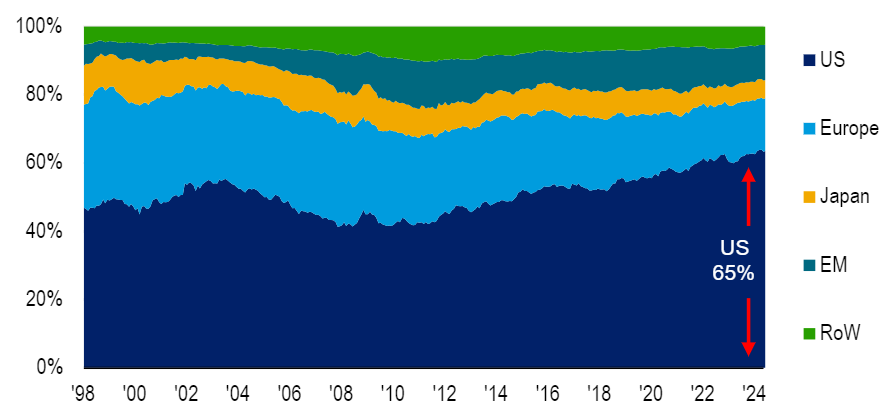
Source: BofA Global Investment Strategy, Datastream, MSCI
We start with the dominance of the US in the global equity market, with American equities now making up 65% of global market capitalisation, a record high. Europe (including the UK and Switzerland) represents just 15%, while emerging markets and Japan account for 10% and 5% respectively.
This concentration shows how Europe and Japan’s combined share of the market, once 39% in 2008, has sharply declined to 20%, underscoring the growing global influence of US equities over the past decades.
Top 5 companies as % of S&P 500 market cap
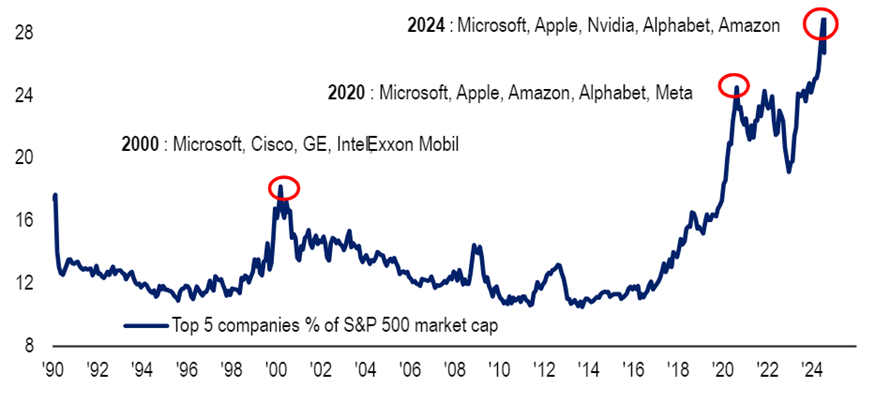
Source: BofA Global Investment Strategy, Bloomberg
“Concentration within the US equity market is currently abnormally high,” Bank of America’s strategists said.
In July 2024, the combined market cap of the S&P 500’s top five stocks (Microsoft, Apple, Nvidia, Alphabet and Amazon) reached a record 29% of the index, highlighting an extreme level of market concentration.
This surpasses previous peaks such as in 2020, when the top five stocks accounted for 25%, and during the 2000 dotcom bubble, when the largest tech firms represented 18% of the S&P 500. This growing concentration again underscores the dominance of a few mega-cap companies in the US equity market.
Tech/telecom/healthcare vs financials/energy/materials as % of global equities
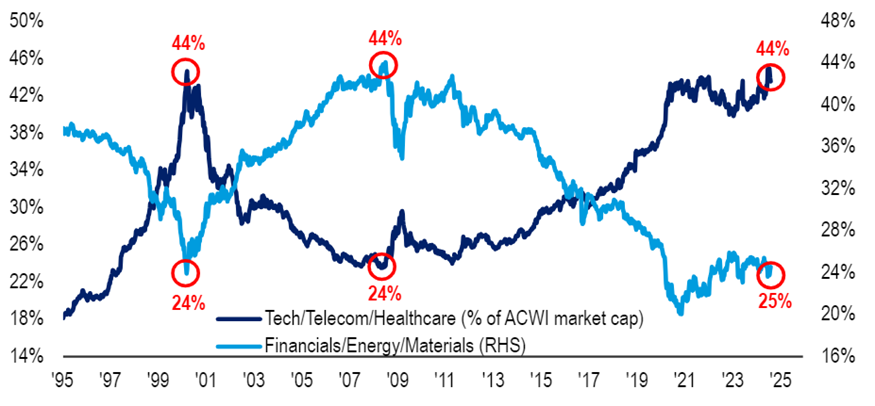
Source: BofA Global Investment Strategy, MSCI, Refinitiv
The chart shows the divergence between growth sectors (tech, telecom, healthcare) and value sectors (financials, energy, materials) within global equities over the past few decades.
Growth sectors have surged to represent 44% of the global equity market capitalisation as of July 2024, near an all-time high, reflecting the increasing dominance of these industries. In contrast, value sectors have seen their share decline from 44% in 2008 to just 25% today.
“The outperformance of growth sectors over value sectors has been another defining feature of the global equity landscape over the past 15 years,” Bank of America’s strategists noted.
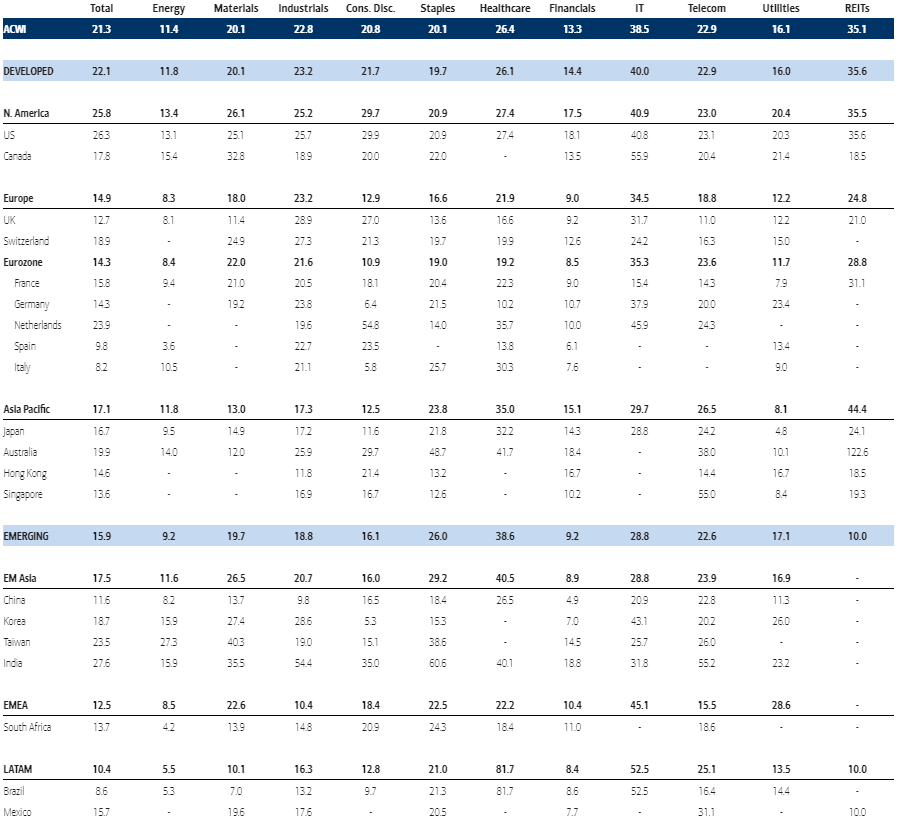
Country/region weightings as a % of sector
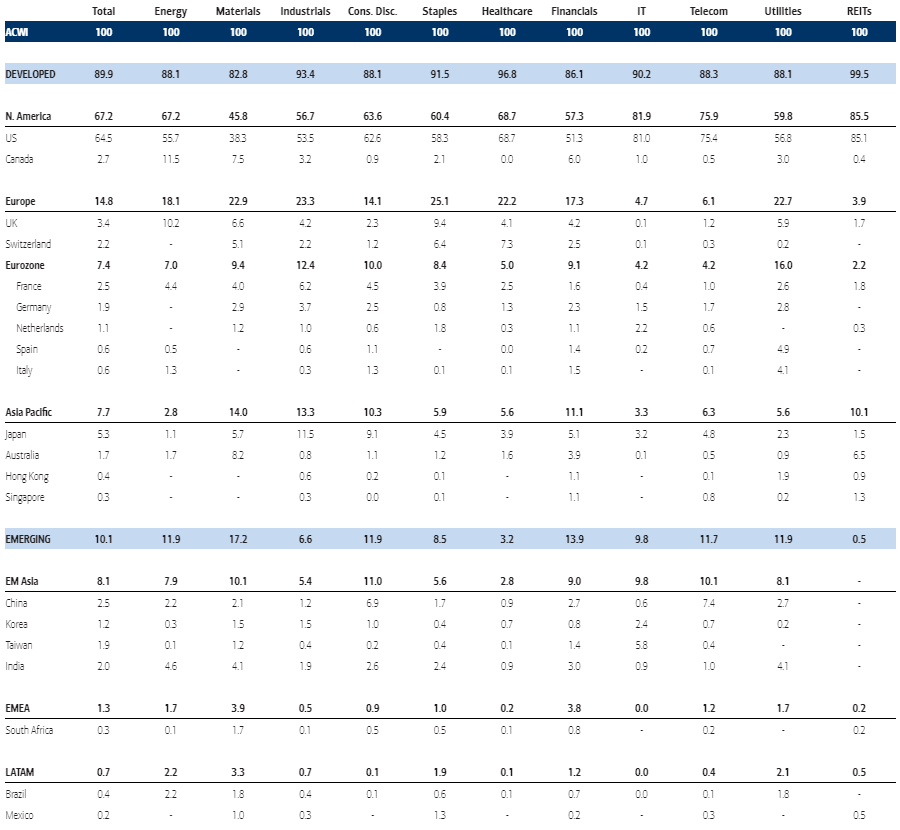
Source: BofA Global Investment Strategy, MSCI, Datastream, As at 31 Jul 2024
The table above shows the country weightings within various sectors of the global equity market, highlighting the dominance of US equities across most industries. The US accounts for 81% of the global technology sector, 75% of telecom and 69% of healthcare.
Europe (14.8% of the index), on the other hand, is more prominent in consumer staples (25%), industrials (23%) and materials (23%), while emerging markets are particularly concentrated in the financial sector, where they represent 14% of global weightings. This demonstrates how different regions have varying levels of influence across specific sectors, but reinforces the US’s overarching dominance.
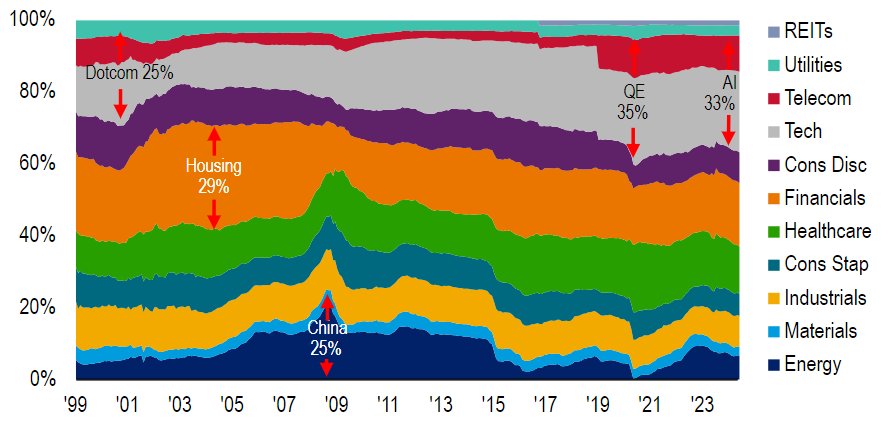
MSCI AC World EPS contribution by sector since 1998
Source: BofA Global Investment Strategy, Datastream, MSCI
This chart illustrates the shift in sector contributions to US equity earnings per share (EPS) from 1998 to 2023, highlighting how different bubbles have driven market concentration.
During the dotcom bubble around 2000, technology and telecom sectors dominated, contributing 25% of EPS. Subsequent periods saw financials leading with 29% during the housing bubble of the 2000s while energy and materials peaked at 25% in the 2008 China-driven commodity surge. More recently, tech and telecom have rebounded, contributing 35% during the 2020 Covid tech rally and 33% in 2024, largely due to the influence of artificial intelligence (AI).
12m trailing P/E ratio by region and sector
Source: BofA Global Investment Strategy, MSCI, Datastream, as at 31 Jul 2024
This table gives a snapshot of trailing price-to-earnings (P/E) ratios across different sectors and regions. Currently, global equities are trading at a trailing P/E multiple of 21.3x, with the US market leading the way at 26.3x, driven largely by the tech sector, which has the highest P/E ratio of 40.8x.
This elevated valuation contrasts with other regions such as Europe, where the overall P/E is 14.9x, reflecting lower valuations in sectors like financials and energy. Emerging markets, despite having some high valuations in specific sectors such as healthcare (38.6x), show more moderate P/E ratios overall, highlighting regional disparities in market valuations.
BofA Global Fund Manager Survey history of most crowded trade
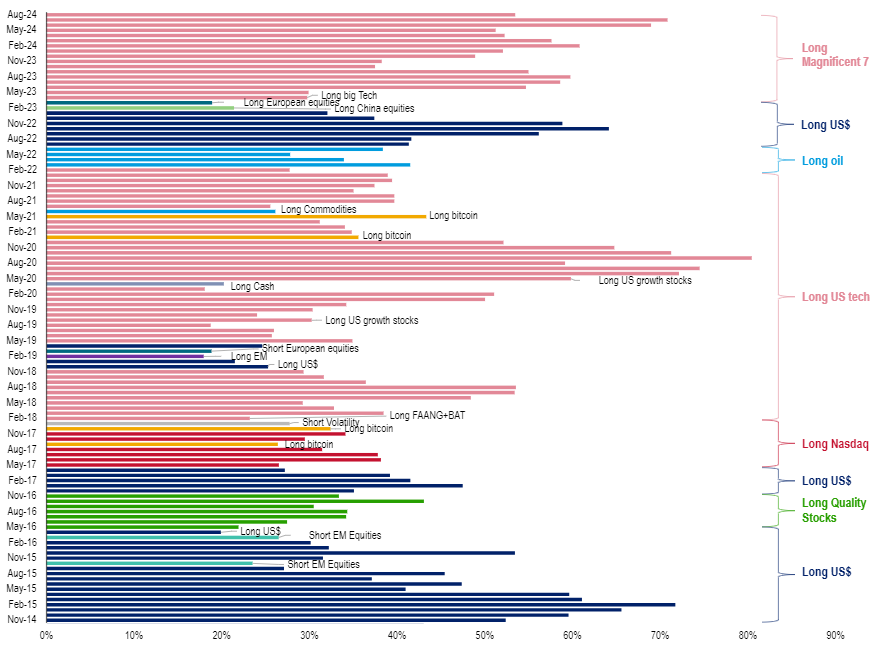
Source: BofA Global Fund Manager Survey, as at Aug 2024 survey
The chart tracks the history of the most ‘crowded trades’, according to the Bank of America Global Fund Manager Survey between 2014 and 2024, illustrating a clear continuation of trends in tech and growth stock dominance.
Since March 2023, the Magnificent Seven tech stocks have topped the list as the most crowded trade, following the earlier popularity of US growth stocks, big tech and FAANG stocks in recent years. This reflects consistent investor awareness of the herding into tech and growth sectors.