Stock market gains have revolved around themes such as momentum, tech and large-caps during 2024 so far, FE fundinfo data shows, although there are some parts of the globe that have diverged from these trends.
Equities are in for another strong year but, as the data that follows will make clear, not all areas of the market have risen to the same extent with some very clear winners and losers being seen.
To explore that, Trustnet has pulled together seven charts looking at the performance of investment factors, industries, market caps and other fund sectors of the major stock markets in 2024.
Global equities
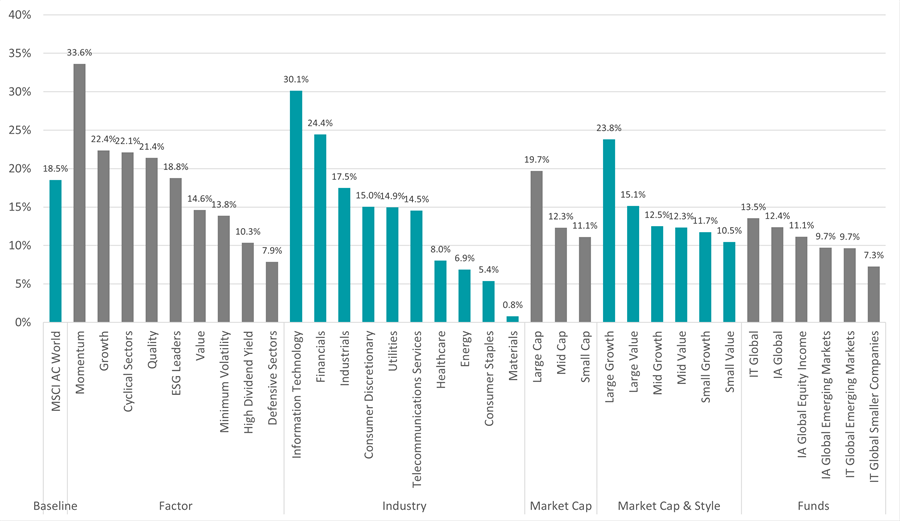
Source: FinXL. Total return in sterling between 1 Jan and 8 Nov 2024
In 2024 so far, the MSCI AC World index has made an 18.5% total return (in sterling terms). This compares with a loss of more than 3% for global government bonds and a 1.4% return from corporate bonds.
Momentum stocks made a much higher return, highlighting a trend-following market. This is highlighted by the continued outperformance of tech stocks and large-cap growth, both of which have led the market for several years thanks to the strength of the so-called Magnificent Seven – most of which have outpaced the MSCI AC World index again this year.
Within funds, the average global equity trust outperformed its open-ended peers by around 1 percentage point, but both were ahead of emerging market funds and trusts. Global smaller companies trusts, however, trailed behind as small-caps underperformed because of nerves around economic growth.
Developed market equities
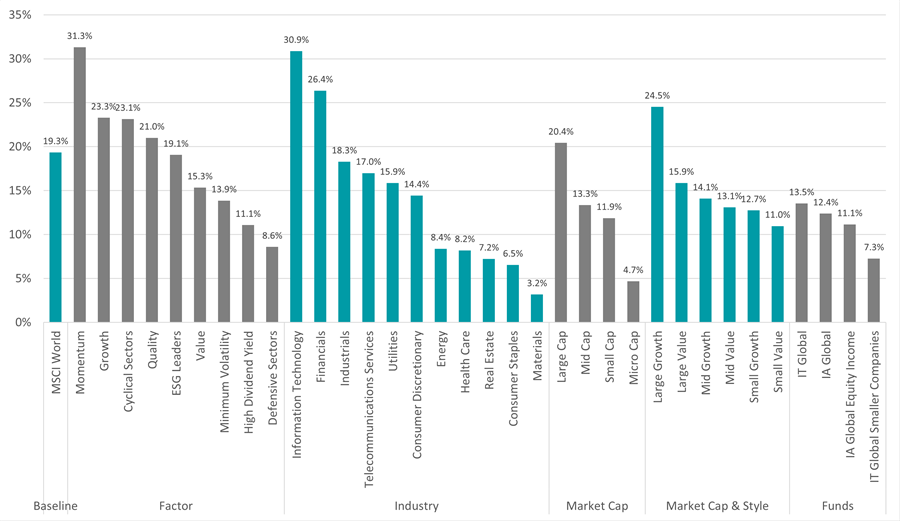
Source: FinXL. Total return in sterling between 1 Jan and 8 Nov 2024
Within developed markets, many of the same trends are apparent – the outperformance of momentum, growth, tech and large-cap stocks. This is because developed markets account for 90% of the MSCI AC World, so the broader index tends to be led by what happens in developed markets.
Looking at the performance of individual developed markets, Singapore made the highest return (27.5%) thanks to strong performance from banks such as DBS, OCBC and UOB. More than half of the MSCI Singapore index is in financials but it is a relatively smaller opportunity set, with just 16 constituents.
The US has been the second best-performing developed market (up 24.8%), followed by Israel (22.5%) and Ireland (22.5%). Just four of the 23 countries in the MSCI World – Portugal, France, Norway and Finland – are down over the year to date.
Emerging market equities
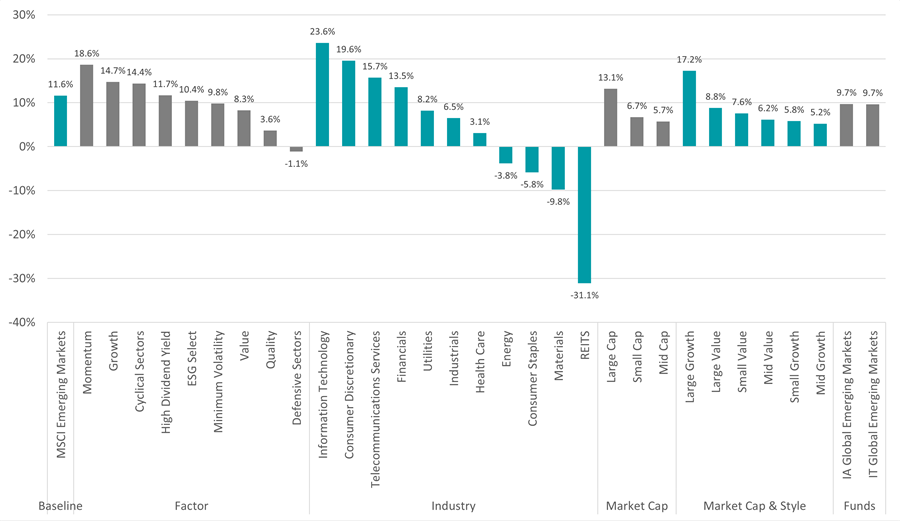
Source: FinXL. Total return in sterling between 1 Jan and 8 Nov 2024
In emerging markets, momentum, growth, tech and large-cap stocks outperformed again but to a lesser extent than seen in developed markets. However, one noticeable difference between the two is the heavy losses experienced by emerging market real estate investment trusts (REITs), which fell because of high interest rates and declines in Chinese homebuilders and real estate developers.
Taiwan was the strongest individual emerging market, with a 37.8% total return. Close to 80% of the MSCI Taiwan index is in tech stocks and more than half is in Taiwan Semiconductor Manufacturing Company alone, which is a beneficiary of the artificial intelligence (AI) boom.
China (which has rallied of late because of a fiscal and monetary stimulus package), Peru and Malaysia also made strong returns. Egypt has fared the worst, down 28%.
UK equities
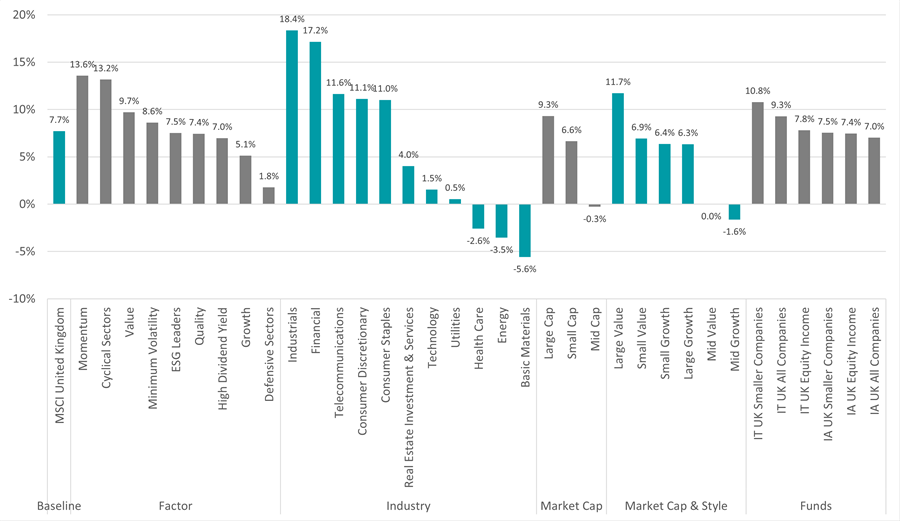
Source: FinXL. Total return in sterling between 1 Jan and 8 Nov 2024
While momentum was the leading investment factor in the UK, there are some differences in how domestic stocks have performed compared with the global market.
Value has outperformed growth by a decent margin, reflecting the high numbers of ‘old economy’ stocks in the UK market. This is also apparent in sector performance: industrials and financials have made close to 20% but UK tech stocks are up just 1.5%.
US equities
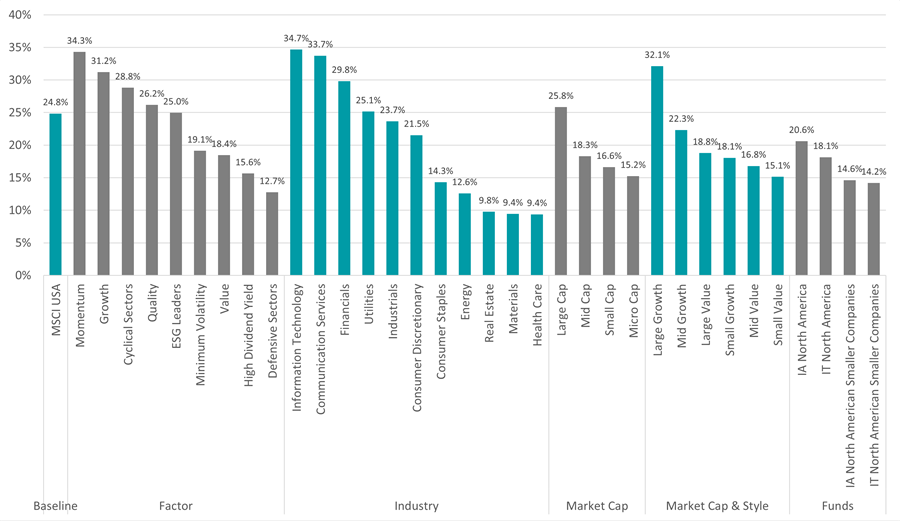
Source: FinXL. Total return in sterling between 1 Jan and 8 Nov 2024
Across the pond, momentum, growth, tech also outperformed in the US. That said, US tech stocks were not as far ahead of areas such as communications and financials as they were on the global stage, adding to hopes that the market is broadening out from its previous narrow leadership.
Although large-cap stocks continued to beat smaller companies, within the IA North America and IT North America sectors, small-cap strategies started to catch up to their larger peers and closed the leadership gap.
European equities
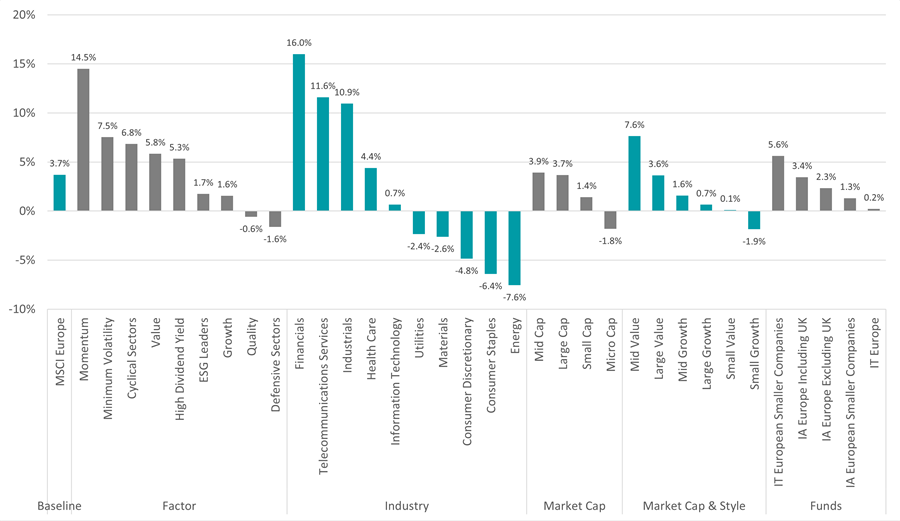
Source: FinXL. Total return in sterling between 1 Jan and 8 Nov 2024
The MSCI Europe index has made just 3.7% over 2024 so far (although some of this is down to currency movements; it’s up 8.2% in euro terms) but some areas – particularly momentum, financials, telecoms and industrials – have performed much better.
Japanese equities
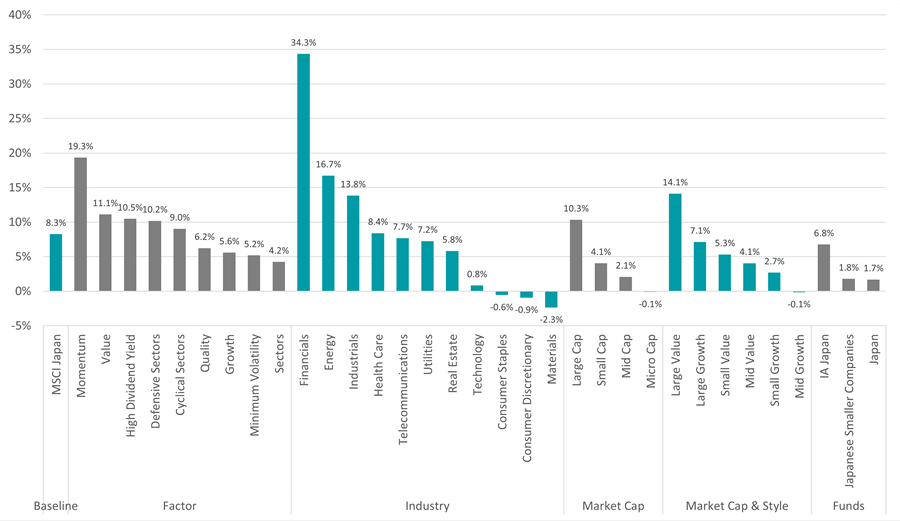
Source: FinXL. Total return in sterling between 1 Jan and 8 Nov 2024
Finally, Japan is another area where value stocks have outperformed growth over the year to date. Like the UK, Japan is seen as a value rather than growth market. But the main feature on the chart above is the massive outperformance of Japanese financials, as banks benefited from an increase in the Bank of Japan’s short-term interest rates.


