


For much of the recent past, tech stocks have been a sensible buy for investors given their strong returns but research by Trustnet shows this is the area where fund selection has mattered the most this year.
Over 2024 so far, the average fund in the IA Technology & Technology Innovation sector has made a 10.8% total return. While tech stocks have led the market for an extended period, they have slipped more recently and the peer group is currently the fifth-best equity sector over the year to date.
The sectors with higher average returns are IA India/Indian Subcontinent, IA UK Smaller Companies, IA North America and IA UK Equity Income, as shown in the chart below.
Average return of the Investment Association’s equity sectors in 2024
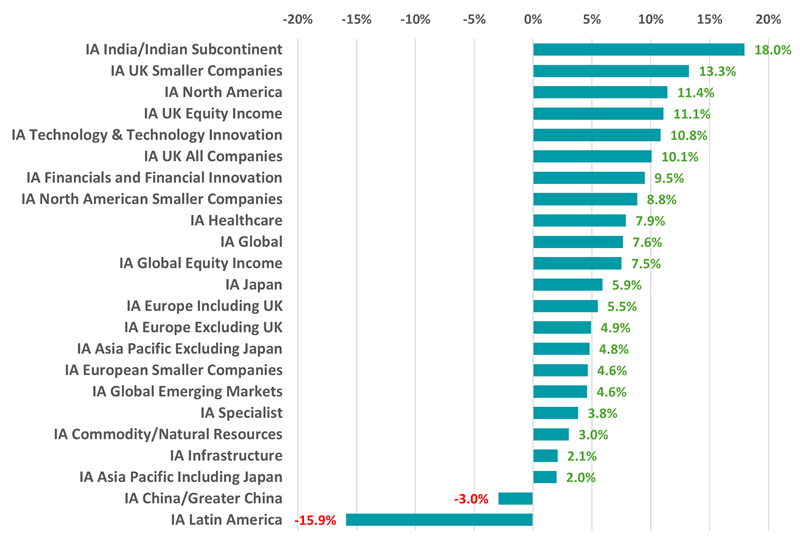
Source: FE Analytics. Total return in sterling between 1 Jan and 29 Jul 2024
As can be seen, only two sectors have made a loss. IA Latin America, which is down 15.9% led by heavy losses from Brazilian stocks, and IA China/Greater China, on the back of lacklustre growth, trouble in the real estate sector and state intervention in areas like tech.
However, looking at the average returns of a sector only tells us so much so in this article, Trustnet is examining the dispersion of returns within the Investment Association’s equity sectors to see where fund selection is making a difference to investors.
To do this, we took the difference between the average return for the first and bottom decile of each sector.
As revealed at the start of the article, the greatest dispersion is in the IA Technology & Technology Innovation sector where there’s a 25.6 percentage point gap between the top decile (average return of 21%) and the bottom decile (average loss of 4.6%).
The top decile comprises iShares S&P 500 Information Technology Sector UCITS ETF (up 23.2%), L&G Global Technology Index Trust (21.3%), Janus Henderson Global Technology Leaders (20.3%) and SSGA SPDR MSCI World Technology UCITS ETF (up 19.3%).
All the funds in the bottom decile have made a loss, which might be surprising given the fact that tech stocks – concentrated on the ‘Magnificent Seven’ (Apple, Microsoft, Amazon, Alphabet, Meta Platforms, Nvidia and Tesla) – have been market darlings for the bulk of recent years.
Those loss-making funds are WisdomTree Cloud Computing UCITS ETF (down 9.7%), WisdomTree Cybersecurity UCITS ETF (-4%), WisdomTree Artificial Intelligence UCITS ETF (-2.8%) and iShares Automation & Robotics UCITS ETF (-1.9%).
Given their specialist remits, these funds are largely underweight the Magnificent Seven although a couple have relatively small weightings to Nvidia in their top 10 holdings. In contrast, the funds in the top decile tend to have much larger positions in multiple Magnificent Seven stocks, explaining the stark difference in performance between the two groups.
However, it’s worth nothing tech stocks – and the Magnificent Seven in particular – were hit by a wave of selling in recent weeks, which means that the trends which have buoyed some funds and held back others might not persist.
Dan Coatsworth, investment analyst at AJ Bell, said: “Expectations have arguably become too high for the so-called Magnificent Seven group of companies. Their success has made them untouchable in the eyes of investors and when they fall short of greatness, out come the knives.
“Other factors are at play with the tech sector sell-off, including geopolitical tensions and election uncertainty, which have driven investors to bank some profits in stuff that’s done well and reallocate money into more value-orientated stocks.”
The dispersions of returns in all equity fund sectors can be seen in the table below.
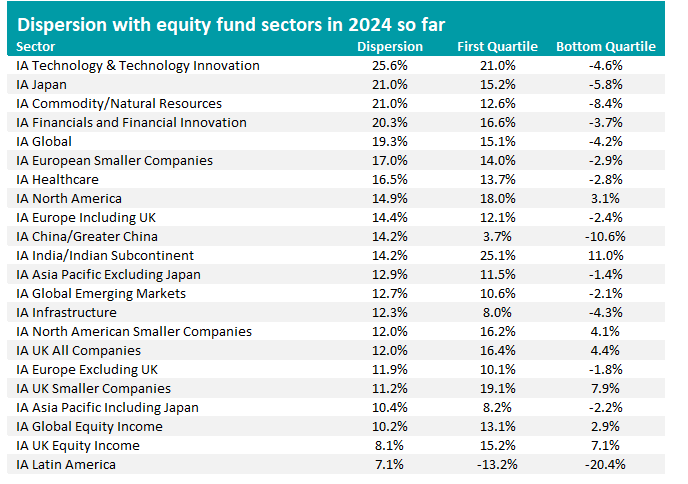
Source: FE Analytics. Total return in sterling between 1 Jan and 29 Jul 2024
IA Japan, IA Commodity/Natural Resources, IA Financials and Financial Innovation and IA Global are other sectors were the difference between the top and bottom deciles is substantial – around 20 percentage points.
Across most sectors, there is a pattern of losses being made in the bottom quartile juxtaposed with strong positive returns in the top quartile, as the market remains split between winners and losers.
But this isn’t the case in all peer groups: even the bottom quartile of the IA India/Indian Subcontinent, IA UK Smaller Companies, IA UK Equity Income, IA UK All Companies, IA North American Smaller Companies, IA North America and IA Global Equity Income sectors have made positive returns.
In the IA India/Indian Subcontinent sector, every fund has made a positive return this year. At the bottom of the sector, JSS Responsible Equity India might be some way behind Jupiter India’s 26.6% total return, but at 9.6% it’s still decent compared with the rest of the Investment Association universe.
The area where there’s been the least dispersion is also the worst-performing peer group: IA Latin America. Here, the average top-decile fund has lost 13.2% in 2024 so far, which is only 7.2 percentage points ahead of the 20.4% loss suffered in the bottom decile.