


Quality funds such as Lindsell Train Global Equity, JOHCM Global Opportunities and SSGA SPDR MSCI World Consumer Staples UCITS ETF are among the IA Global funds that protected investors from some of the past decade’s worst maximum drawdowns, Trustnet research shows.
Maximum drawdown, or the largest peak-to-trough drop in an asset over a specific period, is used by investors to estimate a fund’s potential for loss (although it must be kept in mind that it is always backwards looking).
However, one downside of looking at maximum drawdown over, say, the past 10 years is that it only reveals how the fund reacted in one event – the worst drawdown in that period. Other smaller, but still important, drawdowns aren’t shown in that single data point.
In order to account for this and identify funds with a consistent track record in avoiding the worst market falls, we ran the numbers for the IA Global sector’s maximum drawdowns in 2015, 2018, 2020 and 2022 to see if any funds were in the top quartile for this metric in each one of these years.
The four years were chosen because they all witnessed a maximum drawdown in the MSCI AC World index of more than 10% for varying reasons.
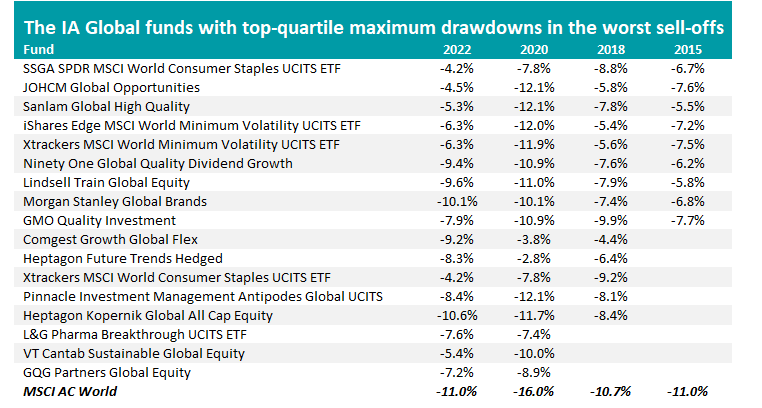
In 2015, the MSCI AC World suffered a maximum drawdown of 11% as investors worried about the slowing Chinese economy while 2018’s 10.7% drawdown sprang from global growth concerns and then-US president Donald Trump’s trade war with China. More recently, the 17% maximum drawdown of 2020 occurred at the start of the Covid-19 pandemic and the 11% drawdown of 2022 stemmed from surging inflation and interest rate hikes.
Source: FE Analytics
The table above shows the IA Global funds that were top quartile for maximum drawdown in the periods examined. There’s 17 in total; nine have track records covering all four years, five weren’t around 2015 and three were only active in the two most recent drawdowns.
At the top of the table (because its average maximum drawdown across the four periods is the lowest) is SSGA SPDR MSCI World Consumer Staples UCITS ETF.
As its name suggests, this $105m ETF tracks the performance of companies in the consumer staples sector across developed markets. This means the largest holdings are the likes of Procter & Gamble, Costco Wholesale, Walmart, Coca-Cola and Nestle.
Consumer staples companies are generally considered good investments during market sell-offs as they produce essential products that people need regardless of economic conditions, such as food, beverages, household goods and personal care items. As a result, they tend to have more stable revenues compared to other sectors.
Next is JOHCM Global Opportunities, which is managed by Ben Leyland and Robert Lancastle. It invests in high-quality companies that trade at attractive valuations, with UnitedHealth, Philip Morris International and Shell being among its biggest holdings.
Analysts at Rayner Spencer Mills Research said: “Historically, the fund has generally delivered outperformance and protected capital well on a relative basis during market drawdowns due to the quality/value bias and willingness to hold cash when they find valuations to be expensive.”
Indeed, one theme that links many of the funds in the above table is quality investing, typically defined as buying companies with strong financial health, stable earnings and durable competitive advantages.
Other funds that are known for investing in quality companies include Sanlam Global High Quality, Ninety One Global Quality Dividend Growth, Lindsell Train Global Equity, Morgan Stanley Global Brands and GMO Quality Investment.
In addition, consumer staples (SSGA SPDR MSCI World Consumer Staples UCITS ETF, Xtrackers MSCI World Consumer Staples UCITS ETF) and healthcare (L&G Pharma Breakthrough UCITS ETF) are often viewed as quality sectors.
Quality managers look for businesses with high return on equity, low debt levels and consistent cash flow generation, often holding them over the long term as they are expected to deliver steady performance across market cycles – including down markets.
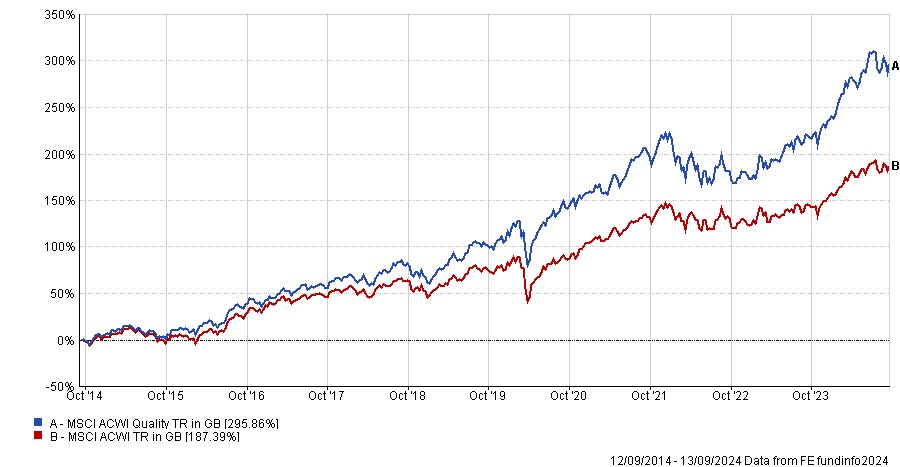
Performance of global quality vs MSCI AC World over 10yrs
Source: FE Analytics
FE Analytics shows the MSCI ACWI Quality index had a significantly lower maximum drawdown than the MSCI AC World in 2015, 2020 and 2022. It also beat growth, value and momentum styles in all three of these years.
The quality index’s maximum drawdown did underperform the wider index in 2018 but by less than 1 percentage point; it also posted a lower drawdown than the growth and momentum indices, but fell harder than value.
Clyde Rossouw, head of quality at Ninety One and co-manager of the Ninety One Global Quality Dividend Growth fund, recently examined how the market has been dominated by the momentum style of investing of late, especially among growth stocks.
This has led to an “unprecedented” concentration among the market’s top performers, which Rossouw believes is “dangerous” and would leave investors “open to a significant amount of concentration risk should sentiment turn”.
“Recent dynamics in the market have strongly favoured momentum, growth and cyclicality, proving to be a headwind for purist quality exposure. Proven earnings resilience is likely to become more important in this stretched near-term market with an increasingly uncertain outlook,” he finished.
“Portfolios consisting of resilient compounders that have successfully compounded cash flows at sustainably high levels of profitability should be well placed to outperform in the coming years. Strong fundamentals have been the bedrock of returns over time. We believe it’s only a matter of time before the market returns to this historical norm.”