


UK-based investors have made subtle changes to their portfolios over the past six months but remain broadly cautious, according to the inaugural Portfolio Panorama report by Janus Henderson Investors.
Key takeaways include overweighting domestic equities relative to a global equity benchmark and going underweight the US, a preference for defensive higher-quality bonds than riskier ends of the fixed income markets and a lack of love for long/short strategies.
The report compared allocations across more than 1,200 portfolios between March and August 2024 (the previous period) and September 2024 to February 2025 (the current period).
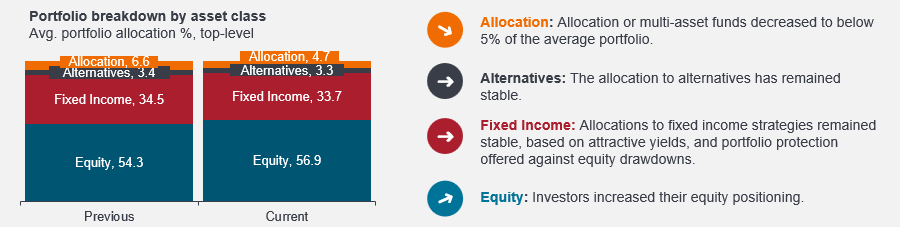
In the past six months, investors have taken on more equity risk, with portfolios around 56.9% weighted to equities, compared to 54.3% in the previous period, while multi-asset and bond holdings were sold slightly, as the below chart shows.
Source: Janus Henderson
Matthew Bullock, head of portfolio construction and strategy for EMEA & APAC at Janus Henderson, said investors added to equities despite “expressing a strong sentiment to remain cautious” – a mindset he believes is the right one in the current environment.
In equities, investors were significantly underweight the US relative to a global equity index, with allocations dropping from 45% to 41% over the past six months. The UK is on the up, worth 21% of the average portfolio, while Europe remained flat at 14%.
“Despite overall strong performance of US markets, UK investors are responding to recent volatility by seeking out opportunities closer to home,” he said.
The most popular sector over the past 12 months was technology, although investors are underweight relative to a global equity index. This was followed by financials and industrials – both relative overweights.
Perhaps the biggest shift however has been the move away from the dominant mega-caps, as investors have looked further down the market capitalisation spectrum. Although slight, the allocations to both mid-caps and small-caps rose in the past six months, as the below chart shows.

Source: Janus Henderson
A “supportive economic backdrop” encouraged investors to start pivoting towards smaller capitalisation companies and shift away from the previously dominant mega-cap technology giants,” said Bullock.
On the fixed income side, investors have stuck to government bonds and high-quality credit, while duration has increased slightly from 3.2 years to 3.3 years as central banks have cut rates. This “indicates growing confidence that inflationary pressures will continue to recede”, said Bullock.
Lastly, in alternatives, the average allocation has nudged slightly lower as a “sustained equity bull run in 2023 and 2024” has caused investors to remain predominantly invested in equities.
Here the biggest change was the fall from grace of long/short strategies, which represented around 1.2% of portfolios between March and August 2024. This allocation has halved over the past six months despite rising uncertainty and volatility.
“The findings from our inaugural Portfolio Panorama report highlight the careful approach UK investors are taking in today’s market environment. The increased focus on small-cap equities suggests a search for new growth opportunities, while strong allocations to fixed income reflect a continued emphasis on stability,” said Bullock.
“It will be interesting to see how investors act over the next few months and whether the decline in appetite for long/short equity strategies is continuous or a short-term trend.”
The final note highlighted investors’ penchant to save money. Some 43% of portfolios was invested in passive strategies, although this is a slight dip from 44% in the previous six months. However, portfolio costs rose marginally from 40 to 42 basis points.