


During periods of market turbulence when investors want to run for the hills, capital preservation strategies come to the fore. Two of the best-known investment trusts that invest cautiously and prioritise downside protection are Personal Assets and Capital Gearing.
Anthony Leatham, head of investment companies research at Peel Hunt, said both trusts “operate at that lower beta end of the flexible sector so you’re expecting these to really kick in when you need to protect capital and offer a defensive ballast against some of the other risk assets you’ve got in your portfolio”.
Both trusts proved their mettle last week when stock markets around the world nosedived in response to Donald Trump’s ‘Liberation Day’ tariffs. Between 1 April and 4 April, Capital Gearing and Personal Assets fell 0.73% and 0.79%, respectively, while the FTSE All Share lost 6.6% and the MSCI World lost 9% in sterling.
Below, Trustnet asked experts to compare the trusts’ relative merits.
How do their portfolios differ?
The two trusts have similar goals but describe and approach them differently, said Ben Yearsley, director of Fairview Investing. “Capital Gearing wants to avoid losing money on a 12-month basis and match equity returns over the long run. Personal Assets aims to preserve the real value of your wealth and avoid a permanent loss of capital,” he explained.
Capital Gearing splits the portfolio between risk assets and index-linked bonds, he explained, whereas Personal Assets buys equities, gold and index-linked bonds, and invests in stocks directly.
Personal Assets’ 11% position in gold, which has been performing strongly, is a distinguishing feature.
Another key difference between the trusts is how equity exposure is achieved. “Personal Assets opts for a quality-growth approach, whereas Capital Gearing tends to buy investment trusts and other collectives, including passive exchange-traded funds (ETFs),” Yearsley said.
Capital Gearing holds a diverse selection of investment trusts including HICL Infrastructure, 3i Infrastructure, BH Macro, Polar Capital Global Financials, PRS REIT and Smithson.
Leatham said Capital Gearing’s portfolio of risk assets is probably its biggest source of differentiation and leads to the trust looking very different from equity indices.
Both trusts are dynamic in the way they allocate capital, for instance moving into risk assets that have become oversold during market drawdowns, he added.
James Carthew, head of investment company research at QuotedData, pointed out that Capital Gearing has more in cash and short-dated securities than Personal Assets (32% versus 24%). Within this area, Capital Gearing has some exposure to corporate credit that Personal Assets does not.
Personal Assets is much larger, with a £1.7bn market cap compared to £893m for Capital Gearing as of 28 February. Both trusts have discount control policies and trade close to their net asset values.
Which trust has the edge for performance?
Personal Assets has delivered higher total returns than Capital Gearing over most time periods, although the trusts measure themselves against different yardsticks. Capital Gearing uses the Consumer Price Index and the MSCI UK IMI as benchmarks, whereas Personal Assets measures itself against a higher level of inflation – the Retail Price Index.
Performance of trusts over 20 years vs sector, UK equities and inflation
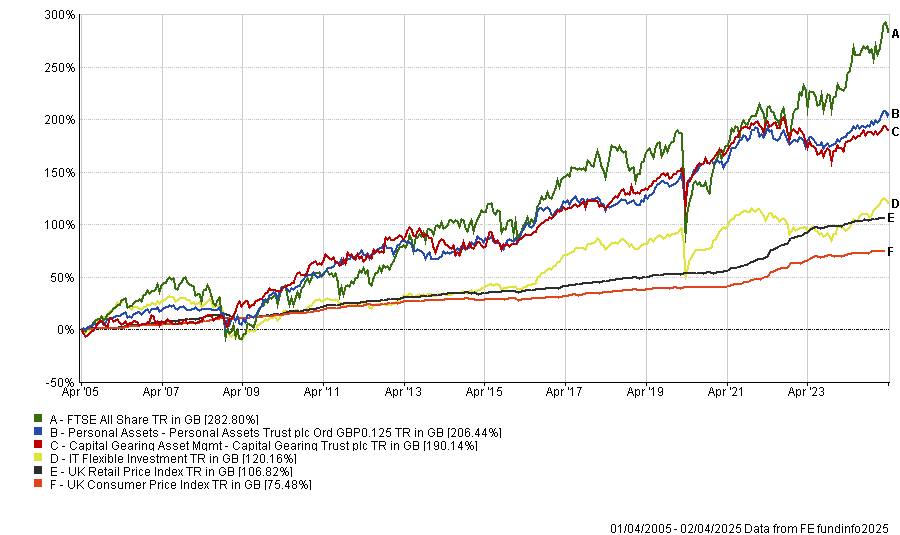
Source: FE Analytics
CG Asset Management (CGAM), which manages Capital Gearing, also compares performance to the MSCI PIMFA Private Investor Conservative Index. It is designed to represent an investment strategy focusing on capital preservation, with lower exposure to high-risk assets.
Capital Gearing has achieved higher returns than this index with a much lower maximum drawdown, as the chart below illustrates.
Capital Gearing’s superior risk/return profile
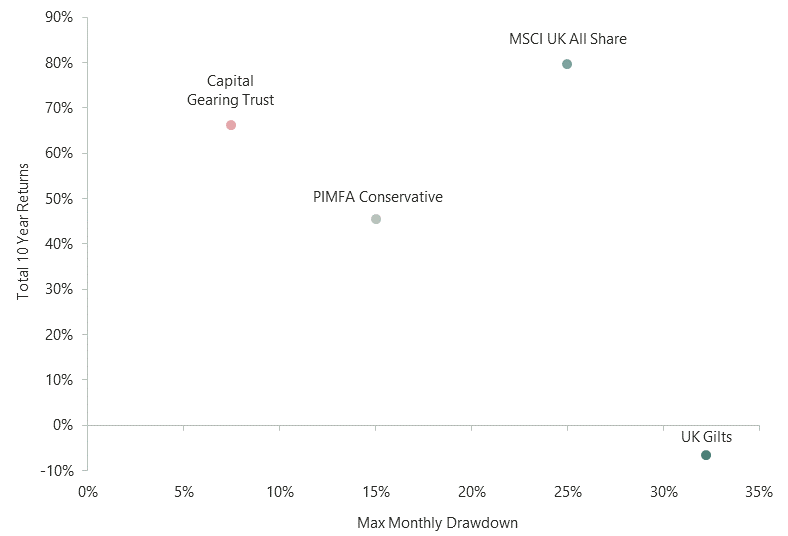
Source: CG Asset Management
Have the trusts protected capital?
Both trusts have achieved their goal of giving investors a smoother ride than equity markets. Their annualised net asset value (NAV) volatility is just over 6%, which is less than half of the FTSE All Share, said Markuz Jaffe, a research analyst at Peel Hunt.
The trusts’ upside/downside capture ratios are similar and testify to their conservative credentials. Over the five years to 31 March 2025, the trusts captured a quarter of the FTSE All Share’s upside but just under a fifth of its downside, Jaffe said.
“Personal Assets has a slightly better upside versus downside relationship and that’s why you get the slightly better performance over most time periods,” he added.
Richard Philbin, chief investment officer (investment solutions) at Hawksmoor Investment Management, said both trusts held up well during “the eye of the Covid storm” between 31 December 2019 and 30 April 2020. The average flexible trust chalked up double-digit losses but Personal Assets gained 2% and Capital Gearing was down by a similar amount.
Performance of trusts vs sector during first four months of 2020
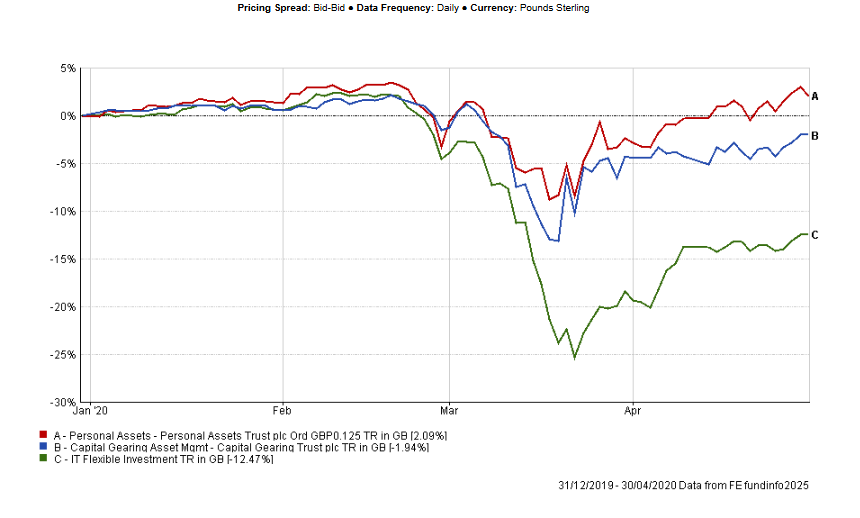
Source: FE Analytics
Both lead managers, Sebastian Lyon at Troy and Peter Spiller at CGAM, “have been at the helm for a long time and have proven themselves over several market cycles”, Philbin continued.
“Both have delivered returns that, when risk-adjusted, have been excellent. They invest mindful of risks – both known and unknown – and have a long-term mindset. This separates them from many other funds in the peer group.”
When it comes to not losing money, the trusts were both in negative territory for two of the past 10 calendar years, although several analysts argued that they should be judged over a full market cycle.
They lost money in 2022 but did not fall as far as global equity markets – Personal Assets lost 3.8% and Capital Gearing fell 4.2%, whereas the MSCI World fell 7.8% in sterling terms.
Carthew said: “Both lost money in NAV terms when rates rose sharply in response to inflation that both of them had been warning against. The hit to Capital Gearing was magnified by discount widening on its investment companies exposure.”
Personal Assets also lost money in 2018, when its 3% loss was in line with the MSCI World but shallower than the FTSE All Share’s 9.5% fall.
Charlotte Yonge, co-manager of Personal Assets, put this into context. “We are long-only, so we do not expect to make money in every environment, but historically the fund has drawn down considerably less than the market,” she said.
Capital Gearing was in positive territory for 2018, up 3%, although it lost 3.3% in 2023 when UK and global equity markets finished in positive territory.
Which of the two trusts do experts prefer?
Yearsley expressed a preference for Personal Assets, which he has held for many years, but he also thinks Capital Gearing has a strong process.
“I think Troy has arguably the stronger team and less succession risk. Troy is more than just Personal Assets and has many different strategies all run on the same process,” he said.
Carthew, however, opted for Capital Gearing. “It trades on a slightly wider (about 1%) discount and, more importantly, has the potential to benefit from narrowing discounts”, he said, due to its investment company holdings.
Peel Hunt has an ‘outperform’ rating for both trusts. Leatham expressed a slight preference for Personal Assets but said investors could hold both trusts side by side, with an equal weighting towards each because their risk asset exposures are so different.
Jaffe added that both trusts charge competitive fees and are “a cost-efficient way of outsourcing to low-risk, multi-asset portfolios”. Capital Gearing’s February factsheet quotes an ongoing charges figure (OCF) of 0.55% while Personal Assets’ OCF is 0.65%.